HASTELLOY® B-3® alloy
Principal Features
Exceptional resistance to HCl and H2SO4 and enhanced structural stability
HASTELLOY® B-3® alloy (UNS N10675) exhibits extremely high resistance to pure hydrochloric, hydrobromic, and sulfuric acids. Furthermore, it has greatly improved structural stability compared with previous B-type alloys, leading to fewer concerns during welding, fabrication, and service.
Like other nickel alloys (in the mill annealed condition), it is ductile, can be formed and welded, and resists stress corrosion cracking in chloride-bearing solutions. Also, it is able to withstand fluoride-bearing media and concentrated sulfuric acid, both of which result in damage to zirconium alloys.
HASTELLOY® B-3® alloy is available in the form of plates, sheets, strips, billets, bars, wires, pipes, tubes, and coated electrodes. It is used in numerous chemical process industry (CPI) applications, especially in the construction of reaction vessels for pure, reducing acid service.
*Please contact our technical support team if you have technical questions about this alloy.
Nominal Composition
Weight %
Nickel
65 min.
Molybdenum
28.5
Chromium
1.5
Iron
1.5
Tungsten
3 max.
Manganese
3 max.
Cobalt
3 max.
Aluminum
0.5 max.
Titanium
0.2 max.
Silicon
0.1 max.
Carbon
0.01 max.
Niobium
0.2 max.
Vanadium
0.2 max.
Copper
0.2 max.
Tantalum
0.2 max.
Zirconium
0.01 max.
| Weight % | |
| Nickel | 65 min. |
| Molybdenum | 28.5 |
| Chromium | 1.5 |
| Iron | 1.5 |
| Tungsten | 3 max. |
| Manganese | 3 max. |
| Cobalt | 3 max. |
| Aluminum | 0.5 max. |
| Titanium | 0.2 max. |
| Silicon | 0.1 max. |
| Carbon | 0.01 max. |
| Niobium | 0.2 max. |
| Vanadium | 0.2 max. |
| Copper | 0.2 max. |
| Tantalum | 0.2 max. |
| Zirconium | 0.01 max. |
Thermal Stability T T T Chart
![]()
The molybdenum content of the nickel-molybdenum (B-type) alloys is such that there is a strong tendency for phases other than the desirable (face-centered cubic) gamma phase to form in the microstructure, particularly in the temperature range 500°C to 900°C. The most deleterious of these alternate phases is Ni4Mo, which forms quickly at certain temperatures, affects ductility, and reduces resistance to stress corrosion cracking.
The chief attribute of B-3 alloy, as compared with other modern B-type materials, is its greatly improved structural stability (in particular its reduced susceptibility to Ni4Mo).
The time-temperature-transformation diagram shown above illustrates the advantages of B-3 alloy over its predecessor (B-2 alloy). Whereas B-2 alloy suffers from the rapid formation of Ni4Mo at around 750°C, it takes several hours (at around 650°C), to induce deleterious second phases in B-3 alloy. This is due to the judicious use of minor elements and a shift in the molybdenum content, to induce the slowly-forming Ni3Mo instead.
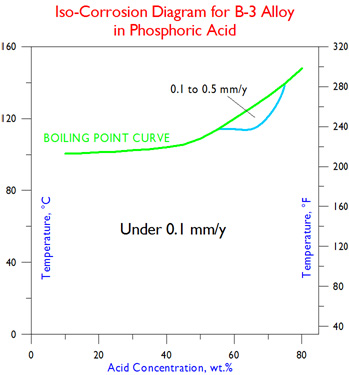
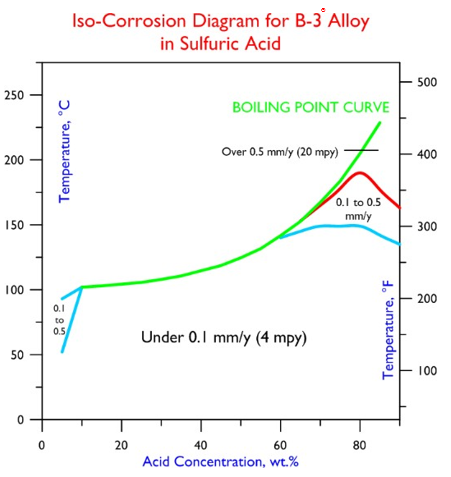
Iso Corrosion Diagrams
Each of these iso-corrosion diagrams was constructed using numerous corrosion rate values, generated at different acid concentrations and temperatures (up to the boiling point). The blue line represents those combinations of acid concentration and temperature at which a corrosion rate of 0.1 mm/y (4 mils per year) is expected, based on laboratory tests in reagent grade acids. Below the line, rates under 0.1 mm/y are expected. The red line in the sulfuric acid diagram indicates the combinations of acid concentration and temperature at which a corrosion rate of 0.5 mm/y (20 mils per year) is expected. Above the red line, rates over 0.5 mm/y are expected. Between the blue and red lines, corrosion rates are expected to fall between 0.1 and 0.5 mm/y. These diagrams do not predict the corrosion rates above the boiling point curves.


Selected Corrosion Data
Hydrobromic Acid
| Conc. Wt.% | 50°F | 75°F | 100°F | 125°F | 150°F | 175°F | 200°F | 225°F | Boiling |
| 10°C | 24°C | 38°C | 52°C | 66°C | 79°C | 93°C | 107°C | ||
| 2.5 | – | – | 0.07 | 0.11 | 0.26 | – | 0.24 | – | 0.02 |
| 5 | – | 0.04 | 0.10 | – | 0.27 | – | 0.25 | – | 0.03 |
| 7.5 | – | – | – | – | – | – | – | – | – |
| 10 | – | 0.05 | 0.15 | – | 0.29 | – | 0.28 | – | 0.10 |
| 15 | – | – | – | – | – | – | – | – | – |
| 20 | – | 0.04 | 0.12 | 0.19 | 0.27 | – | 0.27 | – | 0.10 |
| 25 | – | – | – | – | – | – | – | – | – |
| 30 | – | 0.03 | 0.10 | 0.15 | 0.20 | – | 0.29 | – | 0.29 |
| 40 | – | 0.02 | 0.06 | 0.11 | 0.16 | – | 0.25 | – | 0.43 |
All corrosion rates are in millimeters per year (mm/y); to convert to mils (thousandths of an inch) per year, divide by 0.0254.
Data are from Corrosion Laboratory Jobs 71-97, 26-99, and 49-99.
All tests were performed in reagent grade acids under laboratory conditions; field tests are encouraged prior to industrial use.

Hydrochloric Acid
| Conc. Wt.% | 50°F | 75°F | 100°F | 125°F | 150°F | 175°F | 200°F | 225°F | Boiling |
| 10°C | 24°C | 38°C | 52°C | 66°C | 79°C | 93°C | 107°C | ||
| 1 | – | – | 0.07 | 0.11 | 0.18 | – | 0.21 | – | 0.01 |
| 1.5 | – | – | – | – | – | – | – | – | – |
| 2 | – | – | 0.10 | 0.16 | 0.21 | – | 0.26 | – | 0.04 |
| 2.5 | – | – | – | – | – | – | – | – | – |
| 3 | – | – | – | – | – | – | – | – | – |
| 3.5 | – | – | – | – | – | – | – | – | – |
| 4 | – | – | – | – | – | – | – | – | – |
| 4.5 | – | – | – | – | – | – | – | – | – |
| 5 | – | – | 0.11 | 0.19 | 0.25 | – | 0.30 | – | 0.08 |
| 7.5 | – | – | – | – | – | – | – | – | – |
| 10 | – | – | 0.13 | 0.20 | 0.24 | – | 0.29 | – | 0.13 |
| 15 | – | – | 0.10 | 0.18 | 0.23 | – | 0.28 | – | 0.21 |
| 20 | – | – | 0.10 | 0.15 | 0.21 | – | 0.30 | – | 0.29 |
All corrosion rates are in millimeters per year (mm/y); to convert to mils (thousandths of an inch) per year, divide by 0.0254.
Data are from Corrosion Laboratory Jobs 37-92, 30-94, and 42-95.
All tests were performed in reagent grade acids under laboratory conditions; field tests are encouraged prior to industrial use.

Phosphoric Acid
| Conc. Wt.% | 125°F | 150°F | 175°F | 200°F | 225°F | 250°F | 275°F | 300°F | Boiling |
| 52°C | 66°C | 79°C | 93°C | 107°C | 121°C | 135°C | 149°C | ||
| 10 | – | – | – | – | – | – | – | – | 0.07 |
| 30 | – | – | – | – | – | – | – | – | 0.07 |
| 50 | – | – | – | 0.03 | – | – | – | – | 0.09 |
| 60 | – | – | – | 0.03 | – | – | – | – | 0.14 |
| 65 | – | – | – | – | – | – | – | – | – |
| 70 | – | – | – | 0.02 | – | 0.08 | – | – | 0.21 |
| 75 | – | – | – | – | – | – | 0.04 | – | – |
| 80 | – | – | – | 0.02 | – | 0.09 | 0.05 | – | 0.04 |
| 85 | – | – | – | 0.02 | – | 0.07 | 0.04 | 0.08 | 0.10 |
All corrosion rates are in millimeters per year (mm/y); to convert to mils (thousandths of an inch) per year, divide by 0.0254.
Data are from Corrosion Laboratory Jobs 113-92, 31-94, and 47-97.
All tests were performed in reagent grade acids under laboratory conditions; field tests are encouraged prior to industrial use.

Sulfuric Acid
| Conc. Wt.% | 75°F | 100°F | 125°F | 150°F | 175°F | 200°F | 225°F | 250°F | 275°F | 300°F | 350°F | Boiling |
| 24°C | 38°C | 52°C | 66°C | 79°C | 93°C | 107°C | 121°C | 135°C | 149°C | 177°C | ||
| 1 | – | – | – | – | – | – | – | – | – | – | – | – |
| 2 | – | 0.07 | 0.09 | 0.13 | 0.11 | 0.10 | – | – | – | – | – | 0.01 |
| 3 | – | – | – | – | – | – | – | – | – | – | – | – |
| 4 | – | – | – | – | – | – | – | – | – | – | – | – |
| 5 | – | 0.07 | 0.08 | 0.15 | 0.13 | 0.11 | – | – | – | – | – | 0.01 |
| 10 | – | 0.04 | 0.08 | 0.11 | 0.11 | 0.11 | – | – | – | – | – | 0.01 |
| 20 | – | 0.03 | – | 0.08 | – | 0.11 | – | – | – | – | – | 0.02 |
| 30 | – | 0.02 | – | 0.06 | – | 0.09 | – | – | – | – | – | 0.02 |
| 40 | – | – | – | 0.03 | – | 0.06 | – | – | – | – | – | 0.02 |
| 50 | – | – | – | 0.03 | – | 0.04 | – | – | – | – | – | 0.03 |
| 60 | – | – | – | 0.02 | – | 0.03 | – | – | – | – | – | 0.05 |
| 70 | – | – | – | – | – | 0.01 | – | 0.03 | – | 0.11 | – | 0.15 |
| 80 | – | – | – | – | – | 0.01 | – | 0.03 | – | 0.08 | 0.44 | 4.76 |
| 90 | – | – | – | – | – | 0.02 | – | 0.05 | 0.11 | 0.14 | 0.76 | – |
| 96 | – | – | – | – | – | 0.02 | – | 0.09 | 0.22 | 0.35 | 2.59 | – |
All corrosion rates are in millimeters per year (mm/y); to convert to mils (thousandths of an inch) per year, divide by 0.0254.
Data are from Corrosion Laboratory Jobs 37-92, 29-94, 47-94, 42-95, and 14-96.
All tests were performed in reagent grade acids under laboratory conditions; field tests are encouraged prior to industrial use.
Reagent Grade Solutions, mm/y
| Chemical | Conc. | 100°F | 125°F | 150°F | 175°F | 200°F | Boiling |
| 38°C | 52°C | 66°C | 79°C | 93°C | |||
| Acetic Acid | 10 | – | – | – | – | – | 0.01 |
| 30 | – | – | – | – | – | 0.01 | |
| 50 | – | – | – | – | – | 0.01 | |
| 70 | – | – | – | – | – | 0.01 | |
| 99 | – | – | – | – | – | 0.02 | |
| Formic Acid | 10 | – | – | – | – | – | 0.01 |
| 20 | – | – | – | – | – | 0.02 | |
| 30 | – | – | – | – | – | 0.02 | |
| 40 | – | – | – | – | – | 0.01 | |
| 60 | – | – | – | – | – | 0.01 | |
| 89 | – | – | – | – | – | 0.01 | |
| Hydrobromic Acid | 2.5 | 0.07 | 0.11 | 0.26 | – | 0.24 | 0.02 |
| 5 | 0.10 | – | 0.27 | – | 0.25 | 0.03 | |
| 10 | 0.15 | – | 0.29 | – | 0.28 | 0.10 | |
| 20 | 0.12 | 0.19 | 0.27 | – | 0.27 | 0.10 | |
| 30 | 0.10 | 0.15 | 0.20 | – | 0.29 | 0.29 | |
| 40 | 0.06 | 0.11 | 0.16 | – | 0.25 | 0.43 | |
| Hydrochloric Acid | 1 | 0.07 | 0.11 | 0.18 | – | 0.21 | 0.01 |
| 2 | 0.10 | 0.16 | 0.21 | – | 0.26 | 0.04 | |
| 5 | 0.11 | 0.19 | 0.25 | – | 0.30 | 0.08 | |
| 10 | 0.13 | 0.20 | 0.24 | – | 0.29 | 0.13 | |
| 15 | 0.10 | 0.18 | 0.23 | – | 0.28 | 0.21 | |
| 20 | 0.10 | 0.15 | 0.21 | – | 0.30 | 0.29 | |
| Phosphoric Acid | 10 | – | – | – | – | – | 0.07 |
| 30 | – | – | – | – | – | 0.07 | |
| 50 | – | – | – | – | 0.03 | 0.09 | |
| 60 | – | – | – | – | 0.03 | 0.14 | |
| 70 | – | – | – | – | 0.02 | 0.21 | |
| 80 | – | – | – | – | 0.02 | 0.04 | |
| 85 | – | – | – | – | 0.02 | 0.10 | |
| Sulfuric Acid | 10 | 0.04 | 0.08 | 0.11 | 0.11 | 0.11 | 0.01 |
| 20 | 0.03 | – | 0.08 | – | 0.11 | 0.02 | |
| 30 | 0.02 | – | 0.06 | – | 0.09 | 0.02 | |
| 40 | – | – | 0.03 | – | 0.06 | 0.02 | |
| 50 | – | – | 0.03 | – | 0.04 | 0.03 | |
| 60 | – | – | 0.02 | – | 0.03 | 0.05 | |
| 70 | – | – | – | – | 0.01 | 0.15 | |
| 80 | – | – | – | – | 0.01 | 4.76 | |
| 90 | – | – | – | – | 0.02 | – | |
| 96 | – | – | – | – | 0.02 | – |
Resistance to Stress Corrosion Cracking
One of the chief attributes of the nickel alloys is their resistance to chloride-induced stress corrosion cracking. A common solution for assessing the resistance of materials to this extremely destructive form of attack is boiling 45% magnesium chloride (ASTM Standard G 36), typically with stressed U-bend samples. As is evident from the following results, the three nickel alloys, B-3®, C-276 and 625, are much more resistant to this form of attack than the comparative, austenitic stainless steels. The tests were stopped after 1,008 hours (six weeks).
| Alloy | Time to Cracking |
| 316L | 2 h |
| 254SMO | 24 h |
| 625 | No cracking in 1,008 h |
| C-276 | No cracking in 1,008 h |
| B-3® | No cracking in 1,008 h |
Corrosion Resistance of Welds
To assess the resistance of welds to corrosion, Haynes International has chosen to test all-weld-metal samples, taken from the quadrants of cruciform assemblies, created using multiple gas metal arc (MIG) weld passes. Predictably, the inhomogeneous nature of weld microstructures leads to higher corrosion rates (than with homogeneous, wrought products) in some environments. Nevertheless, HASTELLOY B-3 alloy exhibits very high resistance to the key, inorganic acids, even in welded form, as shown in the following table:
| Chemical | Concentration | Temperature | Corrosion Rate | |||||
| wt. % | °F | °C | Weld Metal | Wrought Base Metal | ||||
| mpy | mm/y | mpy | mm/y | |||||
| H2SO4 | 30 | 200 | 93 | 3.5 | 0.09 | 3.5 | 0.09 | |
| H2SO4 | 50 | 200 | 93 | 5.1 | 0.13 | 1.6 | 0.04 | |
| H2SO4 | 70 | 200 | 93 | 1.2 | 0.03 | 0.4 | 0.01 | |
| H2SO4 | 90 | 200 | 93 | 1.8 | 0.02 | 0.8 | 0.02 | |
| HCl | 5 | 200 | 93 | 11.8 | 0.3 | 11.8 | 0.3 | |
| HCl | 10 | 200 | 93 | 11.4 | 0.29 | 11.4 | 0.29 | |
Physical Properties
| Physical Property | British Units | Metric Units | ||
| Density | RT |
0.333 lb/in3 |
RT |
9.22 g/cm3 |
| Electrical Resistivity | RT | 53.8 μohm.in | RT | 1.37 μohm.m |
| 200°F | 53.9 μohm.in | 100°C | 1.37 μohm.m | |
| 400°F | 54.1 μohm.in | 200°C | 1.37 μohm.m | |
| 600°F | 54.3 μohm.in | 300°C | 1.38 μohm.m | |
| 800°F | 54.4 μohm.in | 400°C | 1.38 μohm.m | |
| 1000°F | 55.4 μohm.in | 500°C | 1.40 μohm.m | |
| 1200°F | 57.5 μohm.in | 600°C | 1.43 μohm.m | |
| Thermal Conductivity | RT |
78 Btu.in/h.ft2°F |
RT | 11.2 W/m.°C |
| 200°F |
83 Btu.in/h.ft2°F |
100°C | 12.1 W/m.°C | |
| 400°F |
93 Btu.in/h.ft2°F |
200°C | 13.4 W/m.°C | |
| 600°F |
104 Btu.in/h.ft2°F |
300°C | 14.8 W/m.°C | |
| 800°F |
116 Btu.in/h.ft2°F |
400°C | 16.3 W/m.°C | |
| 1000°F |
129 Btu.in/h.ft2°F |
500°C | 17.9 W/m.°C | |
| 1200°F |
142 Btu.in/h.ft2°F |
600°C | 19.6 W/m.°C | |
| Mean Coefficient of Thermal Expansion | 77-200°F | 5.7 μin/in.°F | 25-100°C | 10.6 μm/m.°C |
| 77-400°F | 6.1 μin/in.°F | 25-200°C | 11.1 μm/m.°C | |
| 77-600°F | 6.3 μin/in.°F | 25-300°C | 11.4 μm/m.°C | |
| 77-800°F | 6.5 μin/in.°F | 25-400°C | 11.6 μm/m.°C | |
| 77-1000°F | 6.6 μin/in.°F | 25-500°C | 11.8 μm/m.°C | |
| 77-1200°F | 6.5 μin/in.°F | 25-600°C | 11.8 μm/m.°C | |
| Specific Heat | RT | 0.089 Btu/lb.°F | RT | 373 J/kg.°C |
| 200°F | 0.092 Btu/lb.°F | 100°C | 382 J/kg.°C | |
| 400°F | 0.098 Btu/lb.°F | 200°C | 409 J/kg.°C | |
| 600°F | 0.102 Btu/lb.°F | 300°C | 421 J/kg.°C | |
| 800°F | 0.104 Btu/lb.°F | 400°C | 431 J/kg.°C | |
| 1000°F | 0.104 Btu/lb.°F | 500°C | 436 J/kg.°C | |
| 1200°F | 0.112 Btu/lb.°F | 600°C | 434 J/kg.°C | |
| Dynamic Modulus of Elasticity | RT |
31.4 x 10⁶psi |
RT | 216 GPa |
| 200°F |
30.9 x 10⁶psi |
100°C | 213 GPa | |
| 400°F |
30.1 x 10⁶psi |
200°C | 208 GPa | |
| 600°F |
29.3 x 10⁶psi |
300°C | 202 GPa | |
| 800°F |
28.3 x 10⁶psi |
400°C | 197 GPa | |
| 1000°F |
27.2 x 10⁶psi |
500°C | 190 GPa | |
| 1200°F |
26.5 x 10⁶psi |
600°C | 185 GPa | |
| Melting Range | 2500-2585°F | – | 1370-1418°C | – |
*RT= Room Temperature
Impact Strength
| Form | Thickness/Diameter | Test Temperature | Impact Strength | Numberof Tests | |||
| – | in | mm | °F | °C | ft.lbf | J | – |
| Plate | 0.79 | 20 | RT | RT | 353 | 479 | 3 |
| Plate | 0.79 | 20 | -320 | -196 | 334 | 453 | 3 |
| Plate | 1.38 | 35 | RT | RT | 388 | 526 | 3 |
| Plate | 1.38 | 35 | -320 | -196 | 359 | 487 | 3 |
| Bar | 1.58 | 40 | RT | RT | 388 | 526 | 3 |
| Bar | 1.58 | 40 | -320 | -196 | 339 | 460 | 3 |
| Bar | 1.97 | 50 | RT | RT | 390 | 529 | 3 |
| Bar | 1.97 | 50 | -320 | -196 | 338 | 458 | 3 |
*Charpy V-Notch Samples.
RT= Room Temperature
Tensile Strength and Elongation
| Form | Thickness | Test | 0.2% Offset | Ultimate Tensile | Elongation | ||||
| in | mm | °F | °C | ksi | MPa | ksi | MPa | % | |
| Sheet | 0.125 | 3.2 | RT | RT | 61 | 421 | 125 | 862 | 53 |
| Sheet | 0.125 | 3.2 | 200 | 93 | 55 | 379 | 121 | 834 | 57 |
| Sheet | 0.125 | 3.2 | 400 | 204 | 47 | 324 | 110 | 758 | 60 |
| Sheet | 0.125 | 3.2 | 600 | 316 | 44 | 303 | 104 | 717 | 63 |
| Sheet | 0.125 | 3.2 | 800 | 427 | 42 | 290 | 102 | 703 | 62 |
| Sheet | 0.125 | 3.2 | 1000 | 538 | 39 | 269 | 98 | 676 | 59 |
| Sheet | 0.125 | 3.2 | 1200 | 649 | 46 | 317 | 104 | 717 | 56 |
| Plate | Multiple* | RT | RT | 58 | 400 | 128 | 883 | 58 | |
| Plate | Multiple* | 200 | 93 | 54 | 372 | 122 | 841 | 58 | |
| Plate | Multiple* | 400 | 204 | 48 | 331 | 115 | 793 | 61 | |
| Plate | Multiple* | 600 | 316 | 44 | 303 | 111 | 765 | 62 | |
| Plate | Multiple* | 800 | 427 | 41 | 283 | 108 | 745 | 62 | |
| Plate | Multiple* | 1000 | 538 | 40 | 276 | 106 | 731 | 62 | |
| Plate | Multiple* | 1200 | 649 | 42 | 290 | 107 | 738 | 65 | |
*Average values from the testing of 6 lots of plate (of different thicknesses) from three heats.
RT= Room Temperature
Hardness
| Form | Hardness, HRBW | Typical ASTM Grain Size |
| Sheet | 93 | 4.5 – 6.5 |
| Plate | 95 | 3.5 – 7 |
| Bar | 92 | 2 – 7.5 |
All samples tested in solution-annealed condition.
HRBW = Hardness Rockwell “B”, Tungsten Indentor.
Welding and Fabrication
HASTELLOY® B-3® alloy is very amenable to the Gas Metal Arc (GMA/MIG), Gas Tungsten Arc (GTA/TIG), and Shielded Metal Arc (SMA/Stick) welding processes. For matching filler metals (i.e. solid wires and coated electrodes) that are available for these processes, and welding guidelines, please click here.
Wrought products of HASTELLOY® B-3® alloy are supplied in the Mill Annealed (MA) condition, unless otherwise specified. This solution annealing procedure has been developed to optimize the alloy’s corrosion resistance and ductility. Following all hot forming operations, the material should be re-annealed, to restore optimum properties. In the case of cold-formed components of B-3® alloy, solution annealing should be performed prior to subsequent fabrication/welding when cold work is greater than about 7%. Otherwise, B-3® alloy is very susceptible to cracking in the welded region during subsequent fabrication/welding. The cracking may not become obvious until the component has been put into service. Care should also be taken to utilize well-controlled furnace annealing conditions: fast heat-up rate, precise temperature control, and rapid cooling.
The annealing temperature for HASTELLOY® B-3® alloy is 1066°C (1950°F), and water quenching is advised (rapid air cooling is feasible with structures thinner than 10 mm (0.375 in). A hold time at the annealing temperature of 10 to 30 minutes is recommended, depending on the thickness of the structure (thicker structures need the full 30 minutes). For more details concerning the heat treatment of HASTELLOY® B-3® alloy, please click here.
HASTELLOY® B-3® alloy can be hot forged, hot rolled, hot upset, hot extruded, and hot formed. However, it is more sensitive to strain and strain rates than the austenitic stainless steels, and the hot working temperature range is quite narrow. For example, the recommended start temperature for hot forging is 1232°C (2250°F) and the recommended finish temperature is 982°C (1800°F).
Moderate reductions and frequent re-heating provide the best results, as described here. This reference also provides guidelines for cold forming, spinning, drop hammering, punching, and shearing. The alloy is stiffer than most austenitic stainless steels, and more energy is required during cold forming. Also, HASTELLOY® B-3® alloy work hardens more readily than most austenitic stainless steels, and may require several stages of cold work, with intermediate anneals.
While cold work does not usually affect the resistance of HASTELLOY® B-3® alloy to general corrosion, it can affect resistance to stress corrosion cracking. For optimum corrosion performance, therefore, the re-annealing of cold worked parts (following an outer fiber elongation of 7% or more) is important. Cold or hot formed heads should always be annealed after forming, regardless of forming strain level. This is especially important if the material is to be subsequently welded.
Specifications and Codes
Specifications
| HASTELLOY® B-3® alloy (N10675, W80675) | |
| Sheet, Plate & Strip | SB 333/B 333P= 44 |
| Billet, Rod & Bar | SB 335/B 335B 472P= 44 |
| Coated Electrodes | SFA 5.11/ A5.11 (ENiMo-10)F= 44 |
| Bare Welding Rods & Wire | SFA 5.14/ A5.14 (ERNiMo-10)F= 44 |
| Seamless Pipe & Tube | SB 622/B 622P= 44 |
| Welded Pipe & Tube | SB 619/B 619P= 44 |
| Fittings | SB 366/B 366P= 44 |
| Forgings | SB 564/B 564P= 44 |
| DIN | 17744 No. 2.4600 NiMo29Cr |
| TÜV | Werkstoffblatt 517Kennblatt 7615.00Kennblatt 7616.00Kennblatt 7617.00 |
| Others | – |
Codes
| HASTELLOY® B-3® alloy (N10675, W80675) | |||
| ASME | Section l | - | |
| Section lll | Class 1 | - | |
| Class 2 | - | ||
| Class 3 | 800ºF (427ºC)1 | ||
| Section Vlll | Div. 1 | 800ºF (427ºC)1 | |
| Div. 2 | - | ||
| Section Xll | 650°F (343°C)2 | ||
| B16.5 | 800°F (427°C)3 | ||
| B16.34 | 800°F (427°C)4 | ||
| B31.1 | - | ||
| B31.3 | 800°F (427°C)5 | ||
| VdTÜV (doc #) | 752°F (400ºC)6 #517 | ||
1Plate, Sheet, Bar, Forgings, welded pipe/tube, seamless pipe/tube
2Plate, Sheet, Bar, Forgings, fittings, welded pipe/tube 3Plate, Forgings, fittings
4Plate, Bar, Forgings, seamless pipe/tube
5Plate, Sheet, Bar, fittings, welded pipe/tube, seamless pipe/tube
6Plate, Shzeet, Bar, Forgings
Disclaimer
Haynes International makes all reasonable efforts to ensure the accuracy and correctness of the data displayed on this site but makes no representations or warranties as to the data’s accuracy, correctness or reliability. All data are for general information only and not for providing design advice. Alloy properties disclosed here are based on work conducted principally by Haynes International, Inc. and occasionally supplemented by information from the open literature and, as such, are indicative only of the results of such tests and should not be considered guaranteed maximums or minimums. It is the responsibility of the user to test specific alloys under actual service conditions to determine their suitability for a particular purpose.For specific concentrations of elements present in a particular product and a discussion of the potential health affects thereof, refer to the Safety Data Sheets supplied by Haynes International, Inc. All trademarks are owned by Haynes International, Inc., unless otherwise indicated.